
Google Analytics Know How: Funnel Visualization for Mobile Apps
Mike Krass • March 9, 2015 • 5 minutes to readFor the TL;DR crowd: This podcast explores Google Analytics to find out where mobile app users drop off in the purchase process. Listen to the audio above or skim through the excerpt and transcript below for more detailed information.
Google Analytics Know How: Finding Out Where Users Drop Off in Mobile App Purchases with a Funnel Visualization Snapshot
A few weeks back I hosted the inaugural Google Analytics meet up at NextSpace, a co-working space based in San Francisco. As an active Google Analytics practitioner, I was interested in meeting up with non-practioneers to hear their use cases and questions about Google Analytics.
This initial meet up spawned a few really solid topics (more on those in a later post), but the one that we'll discuss today came from Carlos, an iOS developer here in San Francisco:
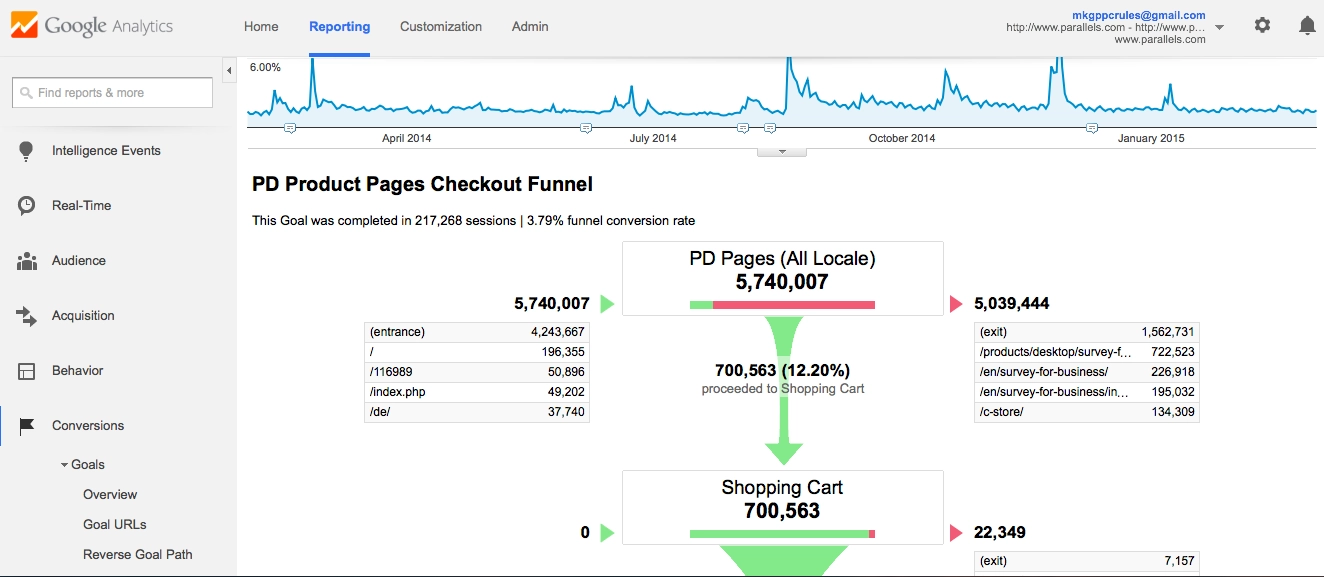
** Can I figure out where my app users drop off in the mobile checkout process? ** Luckily for Carlos, the short answer is YES. Using a Funnel Visualization report (example below), you can figure out at exactly what steps users dropped out of your purchase funnel.
It's pretty simply to wire up this report:
- Navigate to Conversions"
- Expand the "Goals" option
- Click on "Funnel Visualization"
Voila!
For those interested in the full transcript, read along below:
Transcript of Google Analytics meet up
Liz: I'm Liz. I work for a hotel company, and we use Google Analytics exclusively for all of our traffic, and seeing our customer's path, clicking.
Scott: I'm Scott. I work at Razorfrog Web Design. We use Google Analytics to optimize sites, look at page feed, and that kind of stuff.
Max: I work with Scott. I'm Max. We use it for all our clients, some 150 various accounts that we're looking at right now, some much more than others. I'm trying to make sense of it for them, on their behalf, trying to look through it on our behalf, just where we can make improvements, for pages, and conversions, and goals. A lot more for our own site, with goal tracking, and Dropbox, and forms, and those units and things.
Carlos: Hi, I'm Carlos. I'm a developer. I installed it, and I want to know more.
Steven: I'm Steven. I'm a co-founder for a company called [inaudible 00:01:06], and we use Google Analytics for tracking, and here to learn how to use it more.
Natalie: I'm Natalie, and I don't know anything about Google Analytics. I'm here to eat my lunch and listen to the sound of Mike's voice.
Jen: Me too.
Mike: Eat lunch. That's going in the meeting minutes. Eat lunch and listen to Mike. Jen seconds. All right.
Jen: We're the cheerleaders.
Steve: Hi I'm Steve. I'm currently taking some tech courses, but looking to do some development shortly. We just want to learn more about Google Analytics, details and specifics.
Rob: I'm Rob; I'm the founder of Senior Care Web Business. We use Google Analytics for user acquisition, where people are coming from, which channels have ROI. And then also conversion tracking, and what percentage of people are buying something, and where they are coming from so that we can make smarter business decisions. [pause] And eat my sandwich.
Mike: Well, if we want to just start by just addressing use cases, I think Carlos had one out of the gate.
Carlos: Yep.
Mike: So, I think Carlos your initial question was like, "Where do people drop off?" And in Google Analytics, there in the goals section you can do a funnel visualization. So, you can start from anywhere. But we should start from e-commerce.
Max: And you can make lots of them and save them all?
Mike: Yes.
Carlos: So you can basically decide what pages you are tracking at the go?
Mike: Well, Google Analytics, as long as you deploy it on your entire site, or the app, it will grab anything. So you can pick a page here. It just starts at like an index or an entrance. So in reality this is like the homepage. This is our client's homepage.
And there's not much in this goal, because you just basically go from the homepage to trial. And either you make it or you don't. So, you can see here that this shows about 40,000 people, or about a fourth, a little more than a fourth, just drop off. And they end up dropping off to just an exit the website, they make it to checkout but they don't go all the way. They end up going to a product page, a different product page.
So you can do this. This is probably a better funnel. Here we go. This is what it would look like for a shopping cart, so you can see the entrance here on the left. And then it's PD, this is our product pages and then they actually get into the cart. So it shows 10% of people make it to the cart.
And then there's individual phases. So a great thing here to see is that 98, almost 99% of people make it from the cart entrance to their billing info. And then you see the drop-off.
Max: If people wanted to check out, but then they change their minds when they're entering billing.
Mike: Yeah. So that's how we use this for this client is to call out those drop-offs. It's really tangible for this client because with 31,000 drop-offs, their product costs 80 bucks a month, or 80 bucks. So they're leaving $2.5 million on the table in the last month.
So we're not saying you're going to get all of that, because that's never possible, but you could at least get some of it.
Natalie: That's a lot!
[chuckles]
Mike: Yeah. So that's a good example of the question you had, Carlos.
Carlos: Mm-hmm. That absolutely completely answered that.
Mike: And you can do that all these goals that are set up are the same types of goals you can set up for mobile devices.
Carlos: Mm-hmm.
Mike: So, you can set up those goals for in-app purchases, [pause] you know, downloads, anything like that.