
Google Analytics: Making Use of Automated Reports
Mike Krass • March 16, 2015 • 8 minutes to readFor the TL;DR crowd: This podcast explores the automated reports feature of Google Analytics. Listen to the audio above or skim through the excerpt and transcript below for more detailed information.
Google Analytics: What are Automated Reports?
As we mentioned in our post last week, Google Analytics Funnel Visualization Reports for Mobile Apps, we hosted a Google Analytics meet up at our co-working space and got a really lively conversation going between Google Analytics practitioners and relative newbies.
Today's topic came from Max, a front-end web developer at Razor Frog web design:
** My clients are asking for automated reports to be delivered by email. Any helpful hints on that front? ** I personally have a few opinions (based on experience) with automated reports:
- Automated Reports Contain Zero Analysis: These automated reports from GA are a blessing and a curse; with no analysis, really all they do is tell you facts and figures while leaving you guessing what actually drove that activity on your website or mobile app. In short: You end up with more questions than answers.
- GA Automated Reports Should be Contained: Building on point #1 above, these reports can be super helpful if you a) set them up correctly, and b) read them correctly.
We have a few hard and fast rules when agreeing to send automated reports from Google Analytics.
Rule #1: Macro-Level Metrics Only
The last thing you want to do is get completely bogged down in specific report details ... and then not be able to dive into the data to learn more.
Automated reports are static -- you can't adjust the timing, play with the data or add additional segments for analysis. The report arrives as-is and cannot be changed, so design your report according.
As a point of reference, we tend to include the following elements in all automated reports:
- Comparison: If you're looking at an automated report every month, then we want to wire it up so that it comes data to the previous month so some useful analysis can be display.
- Core KPI's Only: Don't worry about adding pages per visit (unless you're a media outlet, of course :-D) but instead focus on core KPI's. Examples include e-commerce activity, sales data, lead activity, email opt-ins ... you get the point.
Rule #2: Cadence is Key
Don't bog your inboxes down by sending automated reports every single day ; you won't even have time to read today's report half the time!
More importantly, the data you analysis day-over-day will put blinders on the big picture of your websites performance; namely sales activity, leads generated or email addresses captured (to name a few KPI's).
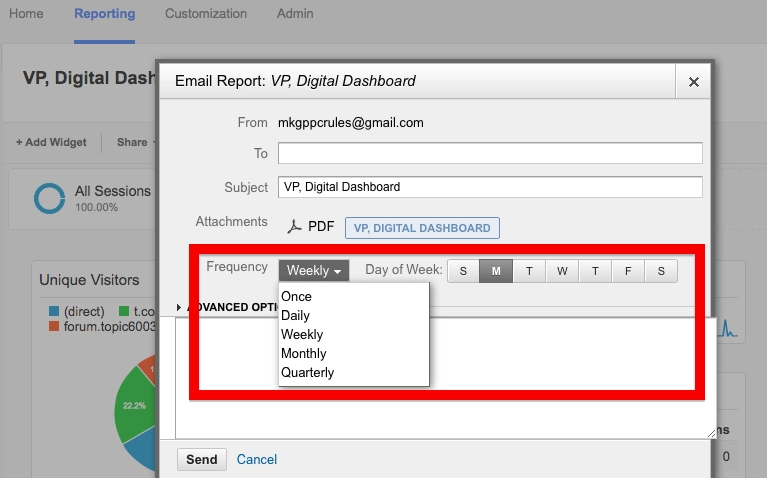
Here' s a highlighted screengrab that shows where you can set the cadence of these reports.
If you have any questions about automated reports in Google Analytics, feel free to give us a shout!
For those interested in the transcript of our meet up, read along below:
Transcript of Google Analytics meet up on Automated Reports
Mike: Oh, Max, you guys were talking about automated reports in a PDF format on a weekly basis. So something like this.
Max: Yeah. We got a few set up, but they're just [pause] cumbersome. And I was trying to spend a while actually getting that content into a body of an email, which doesn't seem like it's possible using Google Analytics. I found some third party service which will do it, if I pay them, of course. It's actually a pretty nice little email. They're really digestible, nice charts and graphs right in line with text, as opposed to, "Hey, look at this PDF, and stare at it for a while and try to figure out what it says."
Mike: Yeah.
Max: Because even a PDF, when you have a screen like this, isn't completely like, "How am I doing? How are things?"
[laughter]
Max: You have to really look at it to figure out what's going on.
Steven: You do get these PDF's to auto-send?
Max: Yeah.
Steven: So they send you weekly reports or whatever they want to?
Max: ...on site here.
Mike: You click on this little button called email, and say daily, weekly, monthly, quarterly. Pick the day. Normally it shows up in the early morning, like between 3 and 6 a.m.
Max: Yeah, it's got some smaller ones weekly and bigger ones monthly. And [pause] the briefmetrics.com are the ones who make the a little more digestible emails. I guess it's some guy that worked at Google Analytics, but came in for a slightly prettier version for pariahs. Kind of hard to digest.
Mike: [chuckle] Yeah.
Jen: See what you did there or like this?
Max: Yeah?
Mike: [laughs] So did your clients start asking for this or did you just bring it to them?
Max: A few. I'm thinking a lot of people would like more, though, and just don't even really know it's there or kind of forgot about it. Just for the most part it's, "Hey, I'm using your sites, and here's how to use it. And here's where all your analytics are, and you're probably never going to go look at them, but you should."
Mike: Hmm.
Jen: Just so you know, I never look at our analytics.
Mike: Here we go. Liz or Rob, do you guys do any automated reports? Or is this not something you guys do at all?
Liz: We may? [laughs]
[laughter]
Jen: It's really new for us, right?
Liz: Our Google Analytics, when we had it set up, was really bad. And within the last three months, our director of e-commerce has spent a lot of time cleaning it up and making new dashboards. So that's where I come in, just helping her, getting it set up. So we're still figuring out our reporting and how we're going to get it to our hotel properties which are our clients.
Mike: And to provide some context, you guys have what 30 or 40 or 50 hotels?
Jen: We have 32 right now, and a lot in the works. We just partnered with a new chat room company and that's going to bring in a lot more hotels. So it's good that we are doing this now, so we can bring down, [pause] so we can start their analytics correctly from the get go.
Mike: So that's 30 something, 32 individual analytics accounts that you guys look at.
Jen: Yes.
Mike: Okay.
Liz: And then, well, we do have, [pause] a lot of the hotels have their individual websites, as well as posts from our main corporate ones. So we look at the analytics of that as well. And then we have our media channels. So we use it for everything. We also have a loyalty club website so yeah.
Mike: Mm-hmm.
Max: One thing that's really nice about the dashboards, if you're not aware that you can import and export them. And so you can just search for analytics dashboards and find websites full of...
Rob: Interesting.
Max: ...e-commerce dashboards, and social media dashboards, and Dropbox dashboards...
Male: Or like WordPress type dashboards.
Mike: Yeah.
Max: ...and really for anything.
Male: ...yeah you just...
Mike: On the left side it says new dashboards, and you can do blank or starter. [pause] I'm sorry; import from gallery is what Max is talking about.
Rob: Interesting.
Mike: So you can pick any of these like these sections.
Max: ...all sorts you can end up with a hundred different ones to see what works.
Male: Uh-huh.
Max: ...or what makes sense.
Mike: So, some of these are really good. Like Occam's Razor Awesomeness is one of the best ones in my opinion. It's run by Avinash something, I can't pronounce his last name. Kaushik? Anyways, he's a GA evangelist. I think he's still a Google employee. And he's got Occam's Razor, his blog is one of the best Google Analytics blogs in the world. The guy's pretty awesome. So he's got a slew of dashboards that he really likes. And what's really nice is they have the ratings here too and how many people are using them. So it gives you an idea before you actually load this up and start monkeying with it. Like, "Are people using this? And what do they think about it," which is nice.
Rob: Can you toggle between the different dashboards easily? Or are you just going to have to use one?
Max: Yeah, they show up a lot there on hot lists.
Mike: So I've got, for this client, we have four dashboards. One is for search-marketing, Twitter ads, LinkedIn, and Facebook. And so you just jump between them. These are all pretty basic.
Steve: The dashboards. Are some free and some you have to pay for?
Mike: They're all free. I've never paid for any.
Steve: ...paid ones.
Mike: Yeah. I know GA has shortcuts. I use this for smaller stuff. But sometimes it's really nice. This is harder to export and share with people, so it's nice to have the dashboard because you can actually share in the solutions gallery. Which means if you have a dashboard you really like you can upload it so other people can use it. Or you can share the template link. So say your client or your team hates getting up email in the morning, there's just a link that will always be constant and they can look at it at any given time. They'll just click on it.
Max: So a nice little hotlink?
Mike: Yeah. So if you're looking, like you can tell for this client we are looking, at advertising in SEO, we always look at generally the same metrics. So this will paint, maybe like three quarters of the story. Like with this SEO dashboard we can tell, "Are trials up or down month over month when you do a comparison? Was revenue down month over month?" And you can just easily take a look at whatever kind of comparison you want. And then you probably dive a little bit deeper into Google Analytics to find out the "why," but it at least tells you where to poke, you know?